
One Simple Fix That Makes LLM Benchmark Rankings Actually Agree
March 05, 2026
Model A wins on MMLU. Model B wins on ARC-Challenge. Model C wins on HellaSwag.
At some point you stop trusting any of them—not because benchmarks are meaningless, but because no two of them seem to tell the same story about which model is actually better.
We ran numbers on this. Across 61 language models and 24 benchmarks, we measured how consistently different benchmarks agree on model rankings using Kendall’s τ. Under standard direct evaluation—take a model, run it on a benchmark, done—average cross-benchmark agreement sits at τ = 0.52. That’s a modest correlation at best: two benchmarks can easily give very different pictures of which model is stronger. The model you’d ship based on MMLU might not be the one you’d pick from ARC-Challenge. That’s not a vague concern. It’s a measurable, systematic problem.
We found a fix. It’s called Train-before-Test.
Paper: Train-before-Test Harmonizes Language Model Rankings — Guanhua Zhang, Ricardo Dominguez-Olmedo, Moritz Hardt (Max Planck Institute for Intelligent Systems, Tübingen and Tübingen AI Center)
arXiv · Code · Leaderboard
Why Benchmarks Contradict Each Other
Think of direct evaluation like sending students to an exam cold, with no shared preparation. Some students happen to have covered material that overlaps with the questions—not because they’re smarter, but because their prior coursework aligned with this particular test. Others didn’t. The scores end up reflecting not just ability, but also how much each student’s background happened to match the exam.
The same thing happens with language models. Different models are pre-trained on very different data: one may have seen a lot of QA-style text and naturally does well on NQ-Open; another absorbed math-heavy data and spikes on GSM8K. When you evaluate out of the box, what you measure isn’t purely model quality—it’s model quality plus the accident of pre-training coverage. This is the problem of training on the test task (Dominguez-Olmedo et al., 2024): a model’s pre-training data mix can confound comparisons in ways that have nothing to do with genuine capability. That confound is enough to make rankings inconsistent across benchmarks.
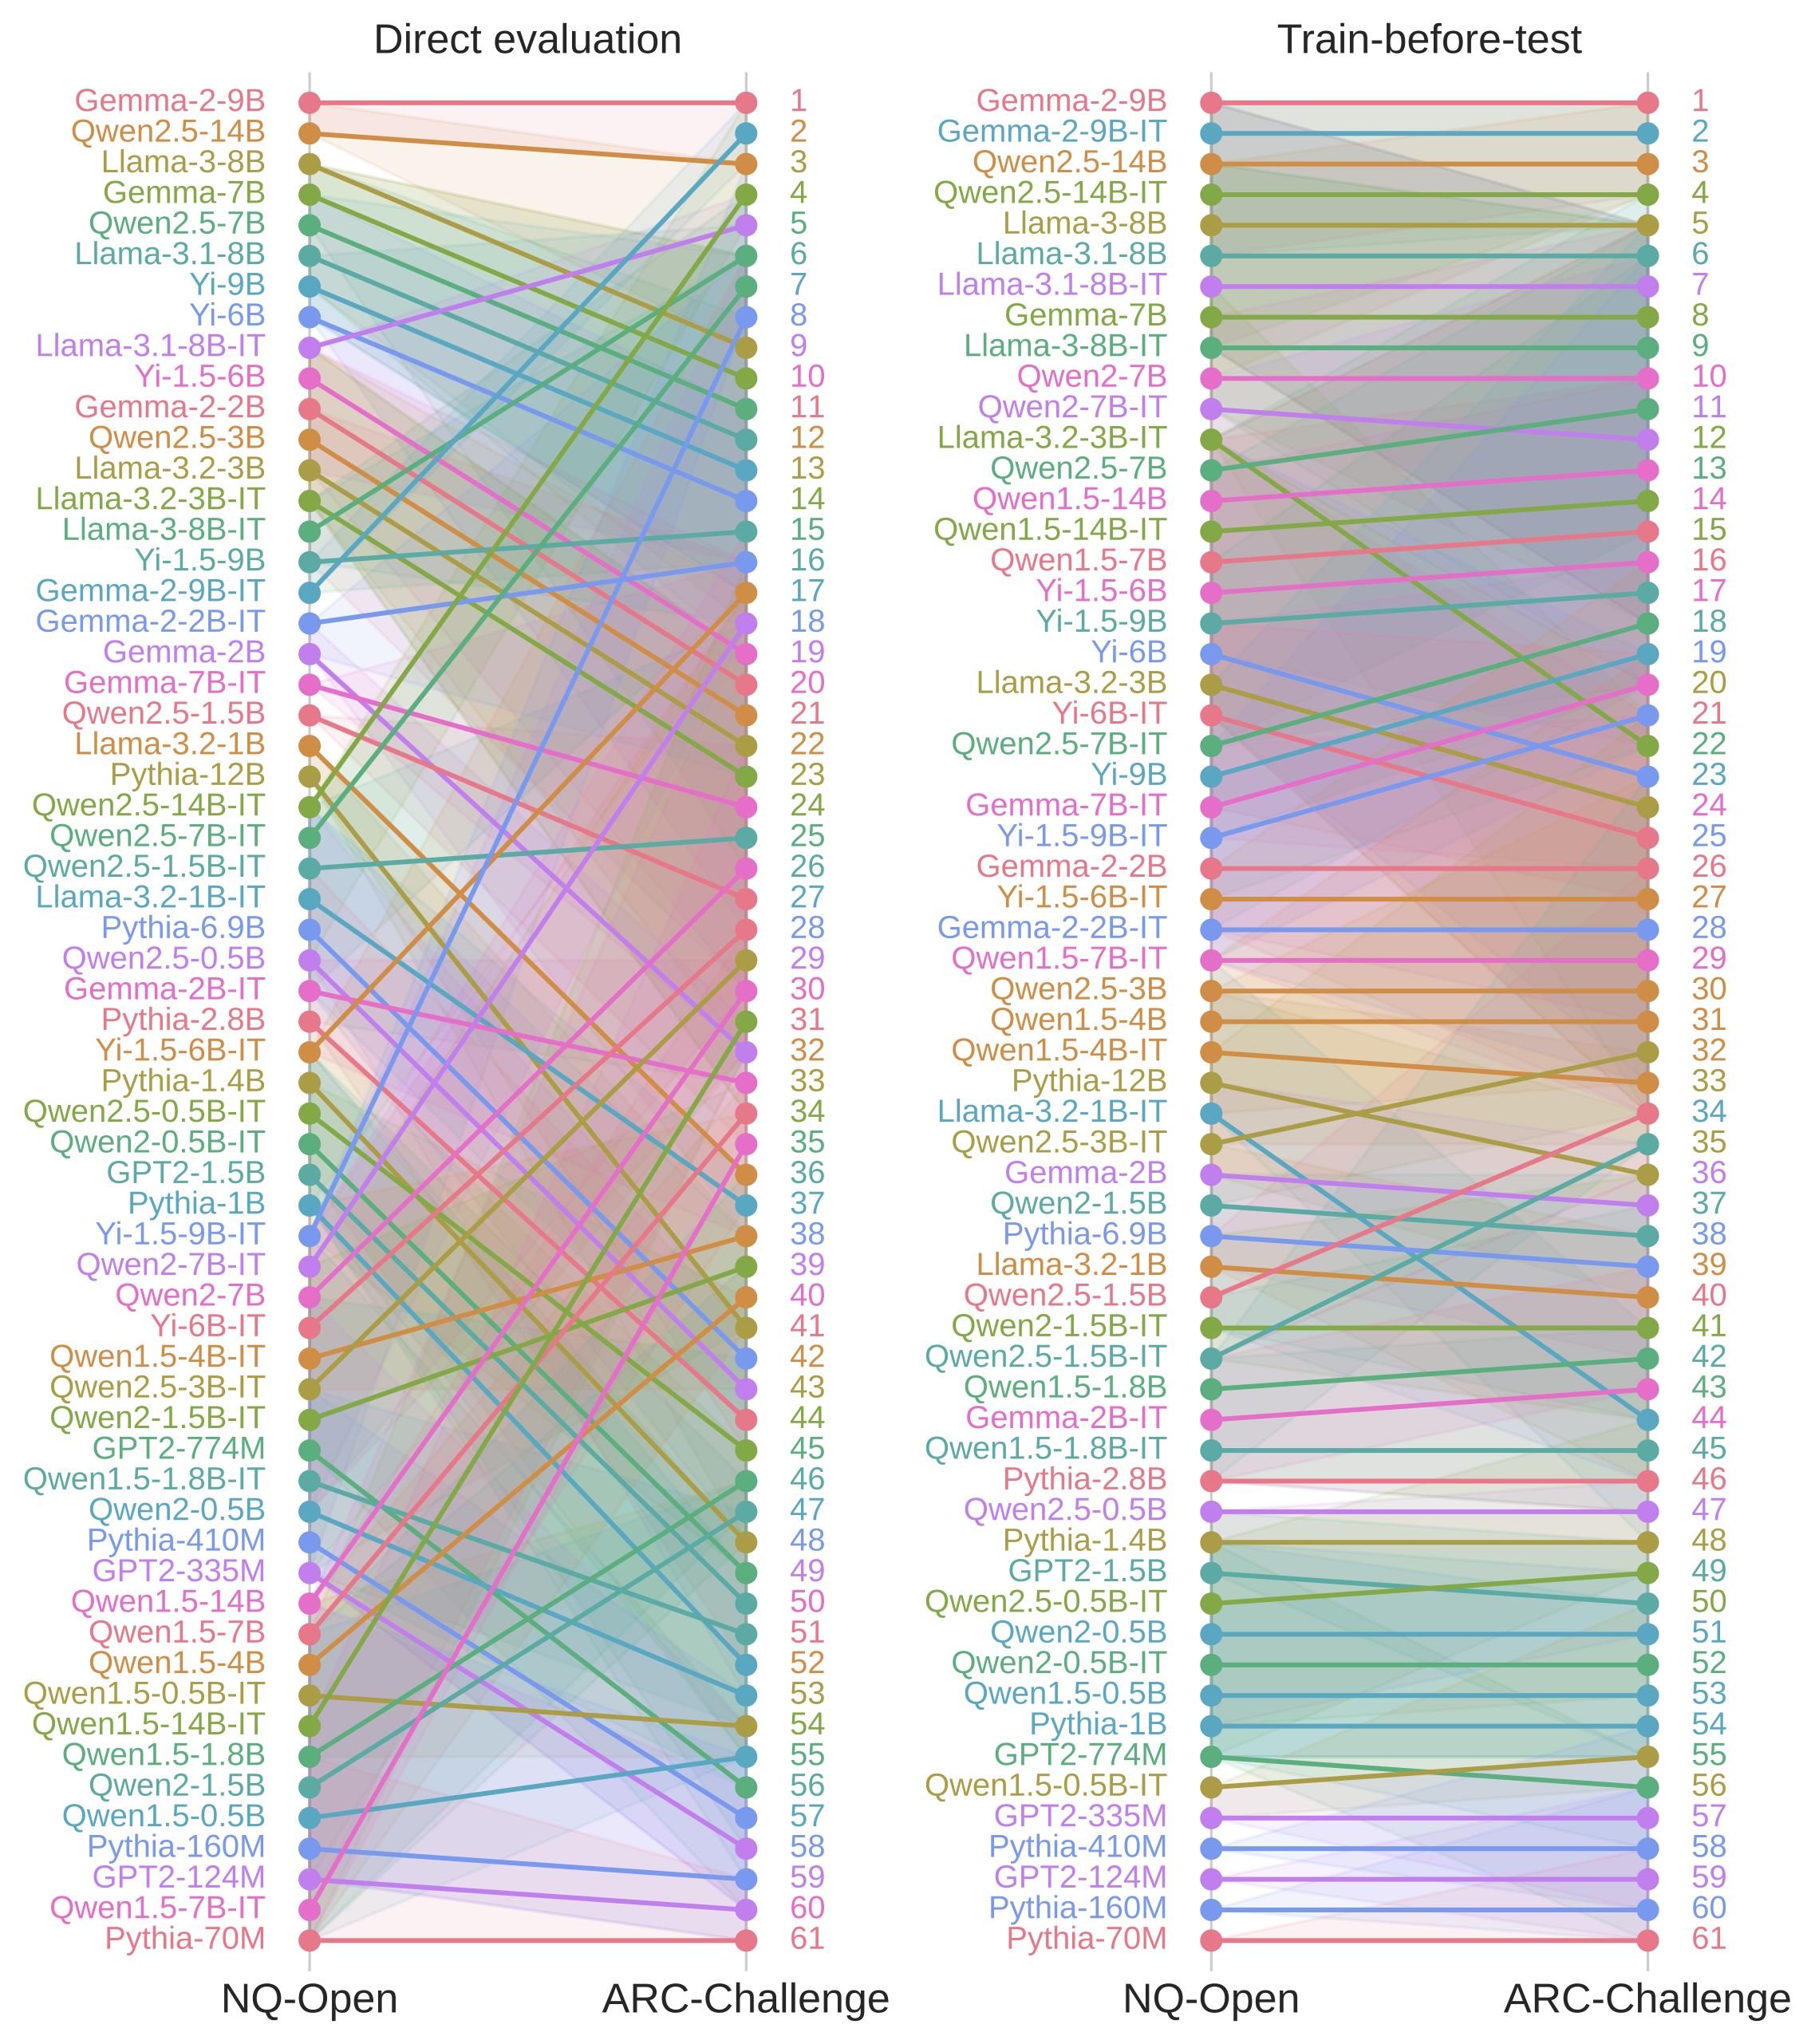
A good benchmark ecosystem should produce rankings that transfer: if a model is genuinely stronger, it should tend to rank higher across many tasks—not ping-pong between #1 and #17 depending on the dataset.
Train-before-Test
Our fix is simple: before evaluating any model on a benchmark, we first fine-tune all models on that benchmark’s training split—then test on the test split. Everyone gets the same preparation.
The benchmark stops asking “who was already ready for this?” and starts asking “who learns this best, given the same starting point?” That shift reorients evaluation from measuring pre-training luck toward measuring model potential—how well a model adapts and generalizes under comparable supervision.
Finding 1: Rankings Finally Agree
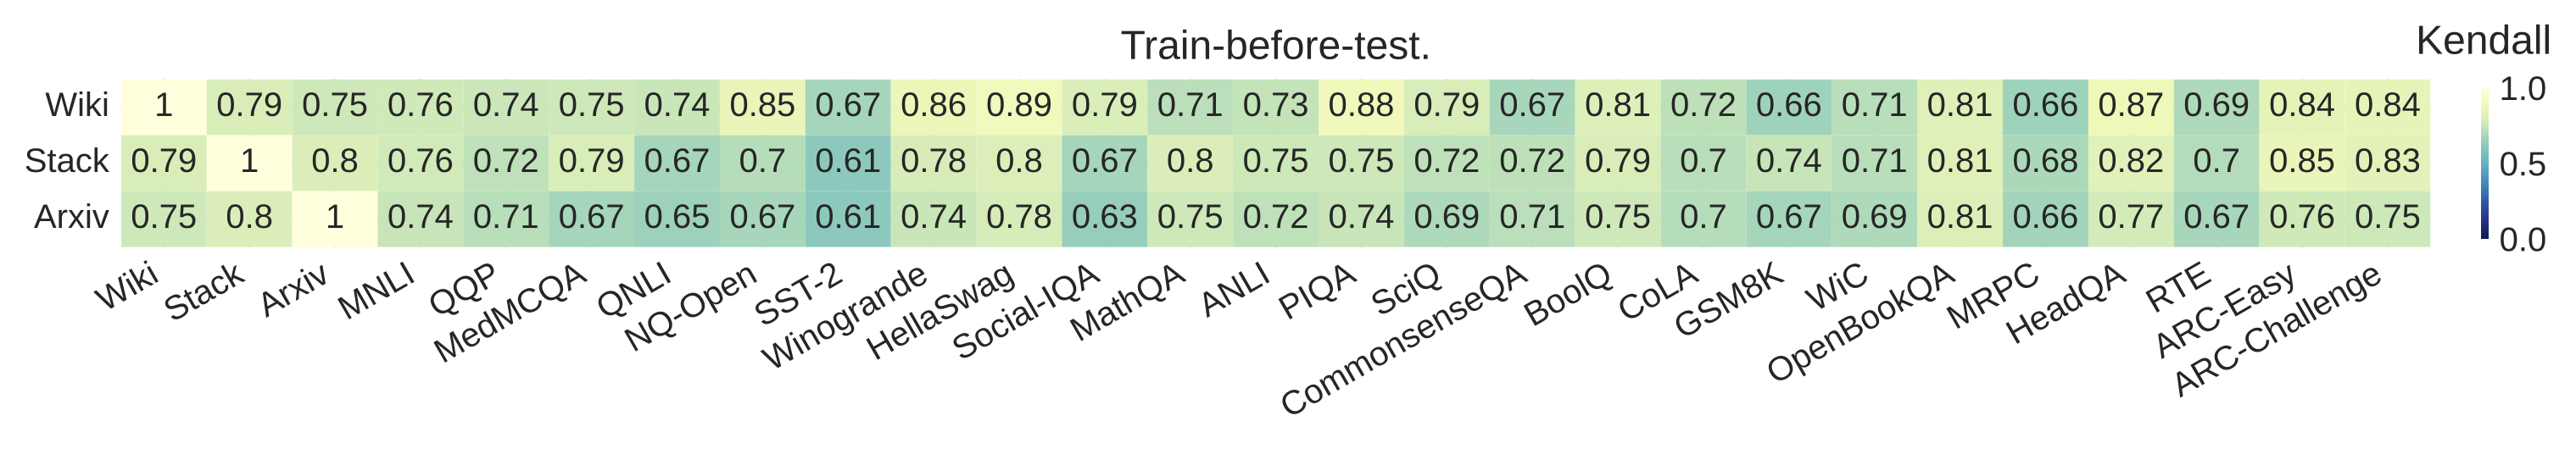
After TBT, average cross-benchmark agreement jumps from τ = 0.52 to τ = 0.76, consistently across all 24 benchmarks—no cherry-picking.
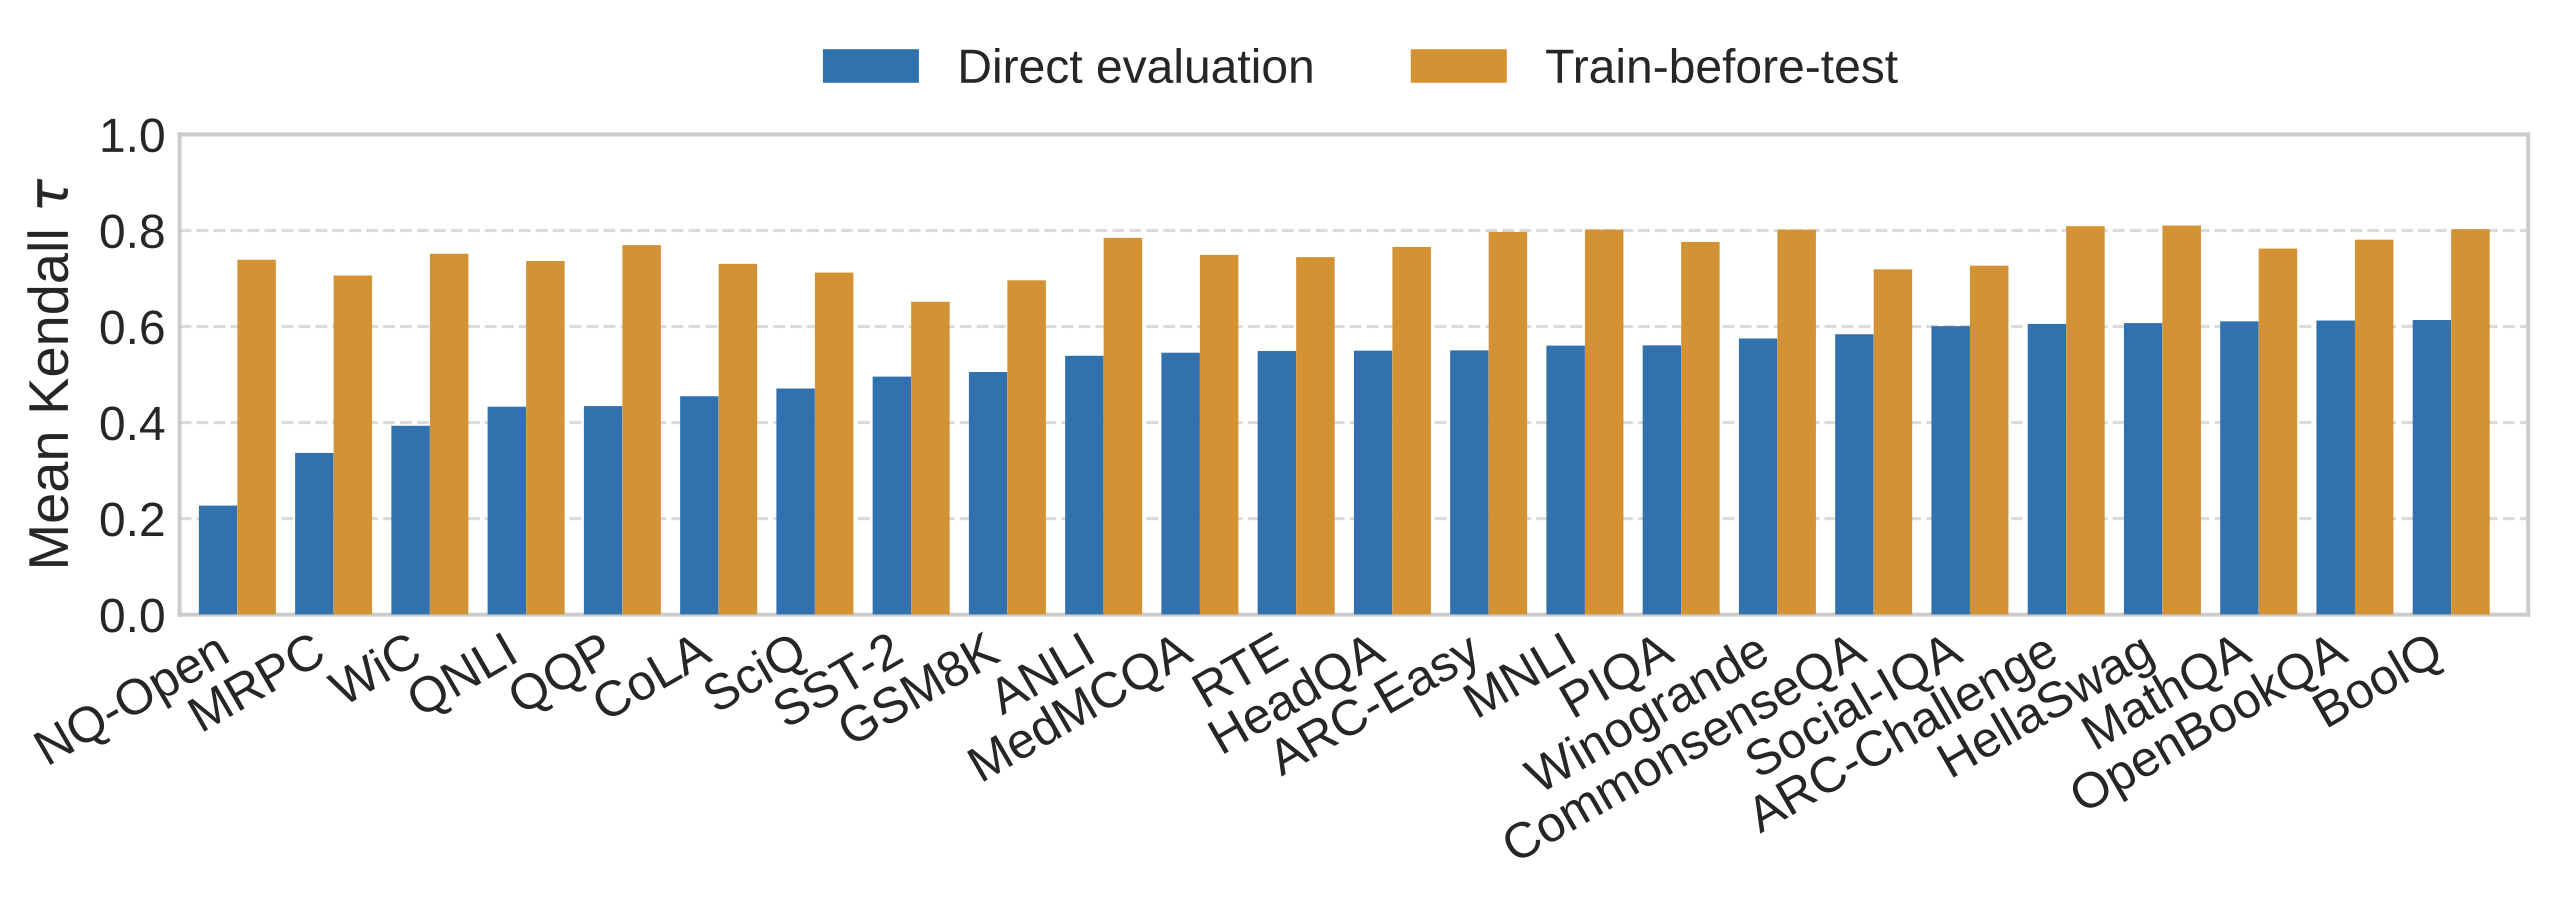
NQ-Open is the starkest case. Under direct evaluation it’s essentially an outlier—average τ = 0.23 with other benchmarks, telling a completely different story from everyone else. After TBT: τ = 0.74. It rejoins the consensus.
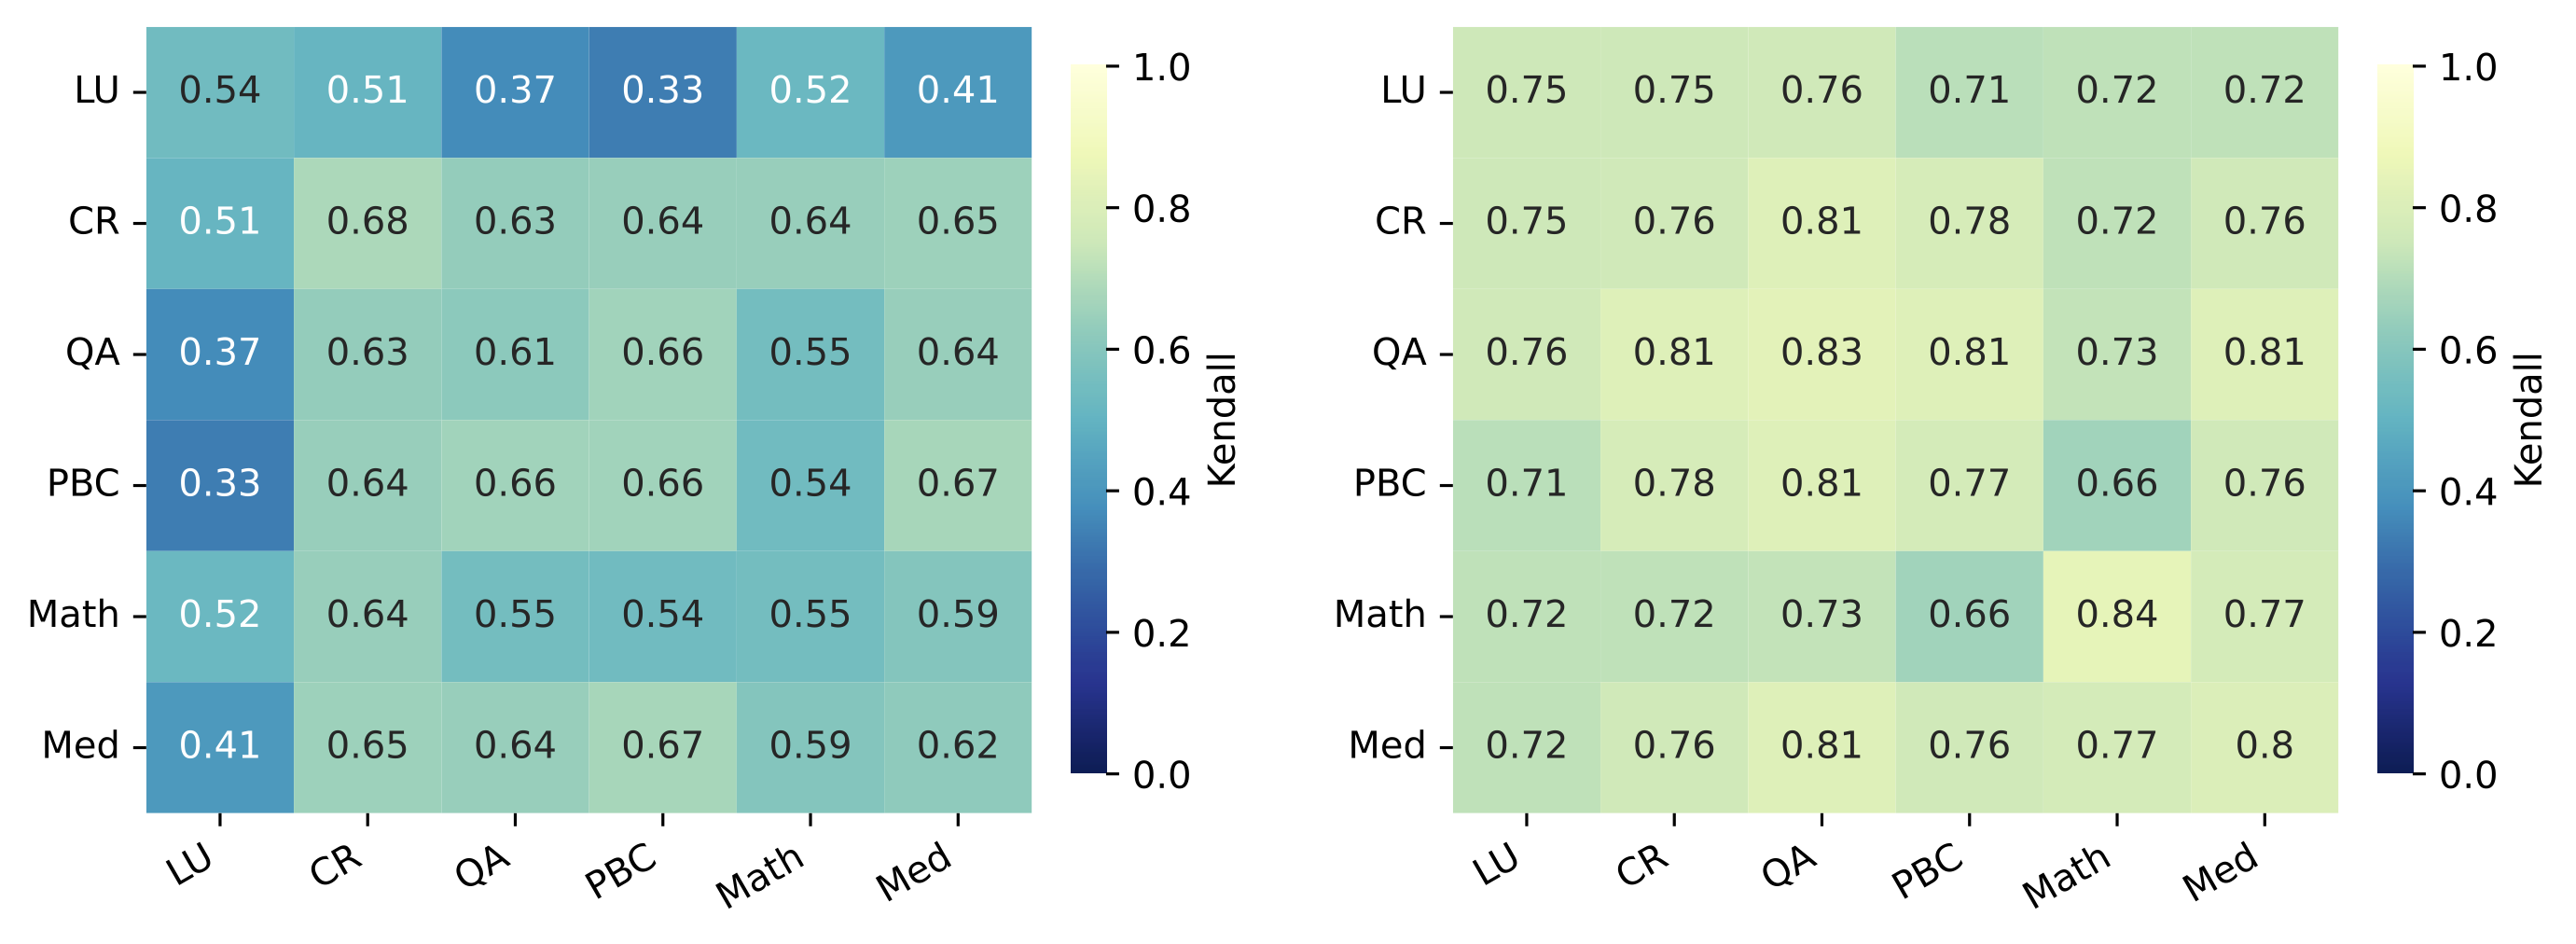
The gains hold even within task categories. We grouped the 24 benchmarks into six types: Language Understanding (LU), Commonsense Reasoning (CR), Question Answering (QA), Physics/Biology/Chemistry (PBC), Math, and Medical (Med). Even benchmarks measuring the same type of task show surprisingly low within-group agreement under direct evaluation—Language Understanding averages τ = 0.54 among itself, Math just 0.55. TBT lifts these to 0.75 and 0.84, and cross-category consistency improves across the board.
Finding 2: Perplexity Works Again
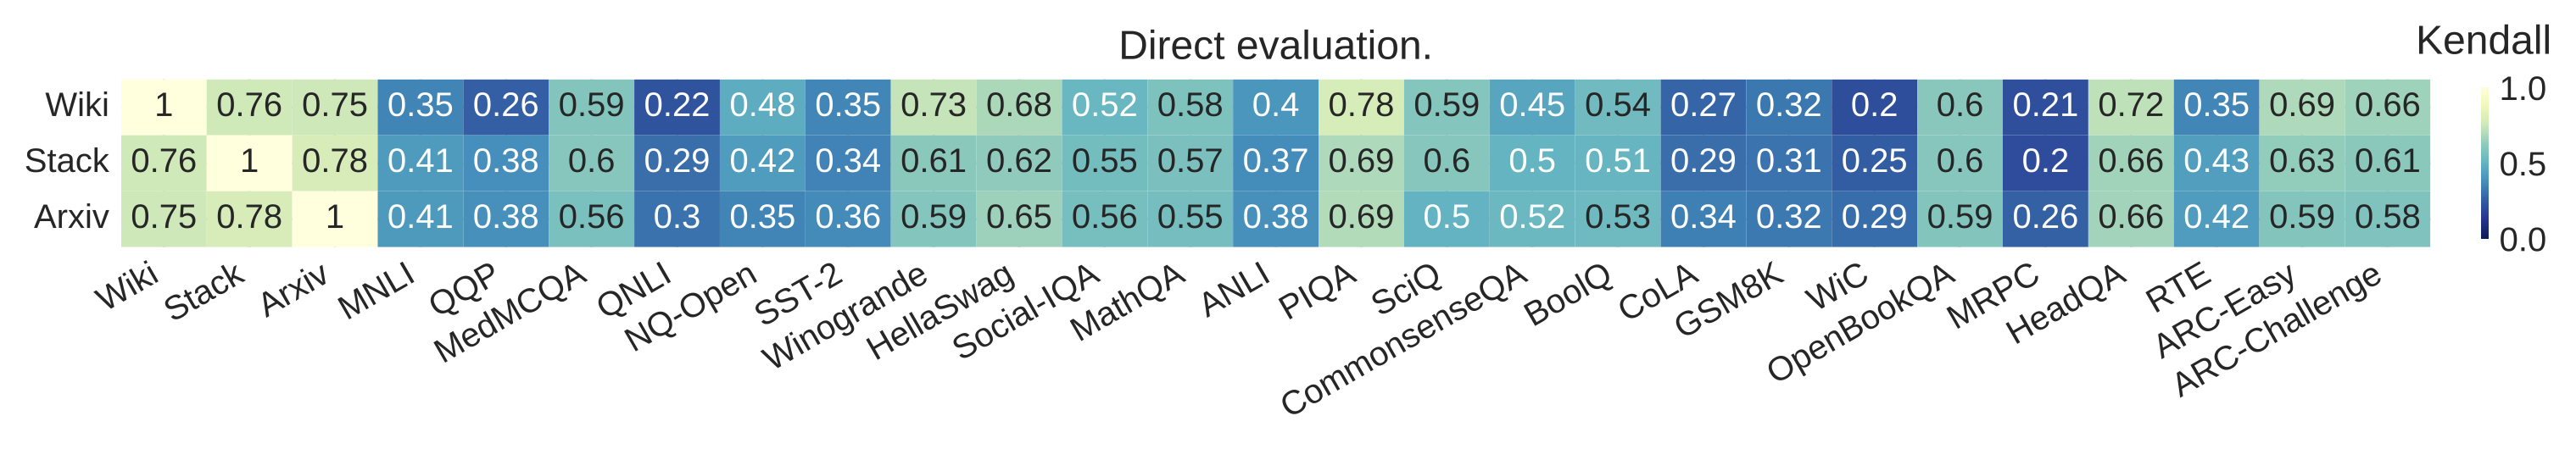
Perplexity is the most fundamental measure of language model quality—and it’s had an embarrassing few years. Modern models with better perplexity often don’t rank better on downstream benchmarks. The metric that should mean the most has started to feel nearly useless.
TBT restores the relationship substantially: correlation between perplexity rankings and downstream task rankings goes from τ = 0.48 under direct evaluation to τ = 0.74 after TBT.
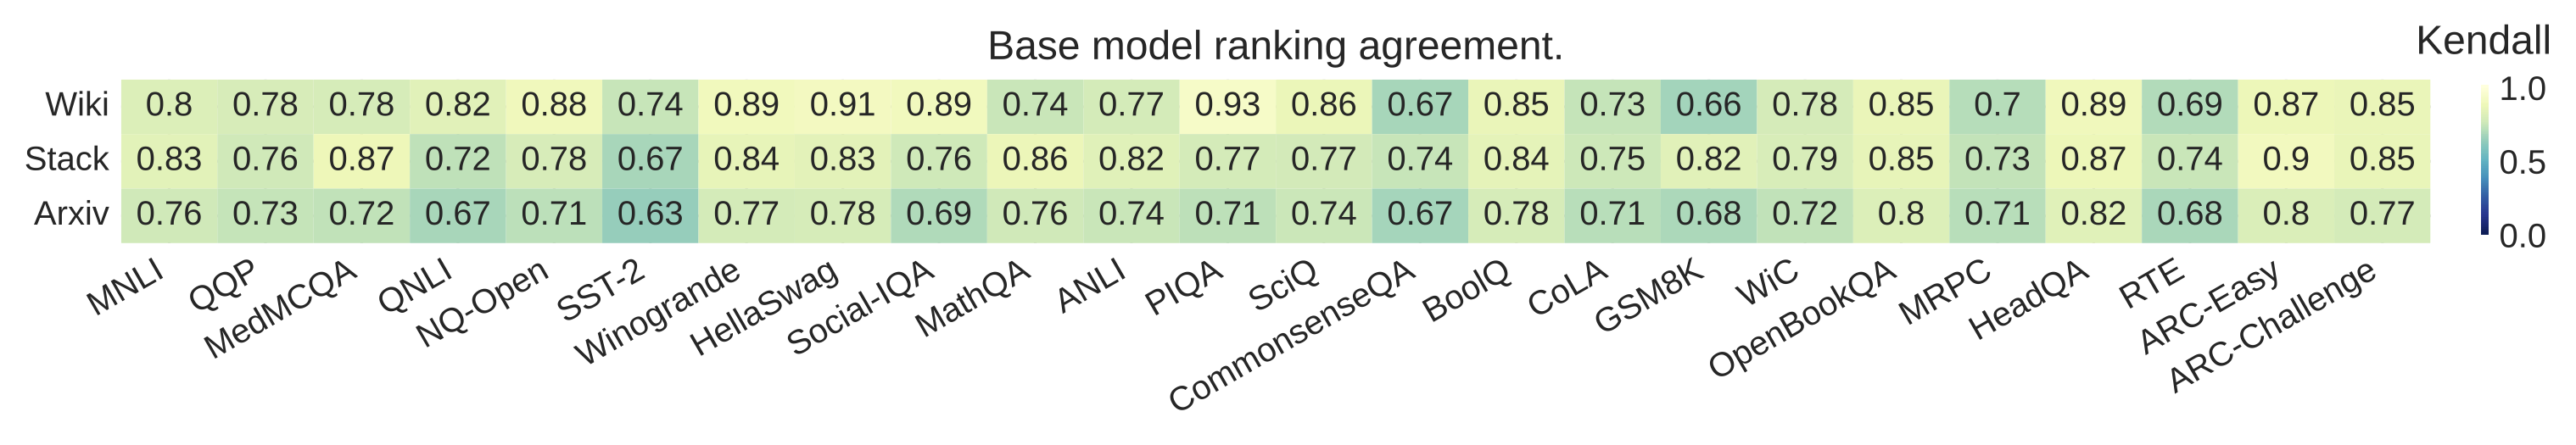
There’s a practical bonus for anyone selecting base models. Pre-fine-tuning perplexity predicts post-TBT downstream performance at τ = 0.78 for base models. The fact that a metric computed before any fine-tuning can predict performance after it also suggests that the ranking consistency TBT reveals isn’t an artifact of the fine-tuning process—it reflects something inherent to the models themselves.
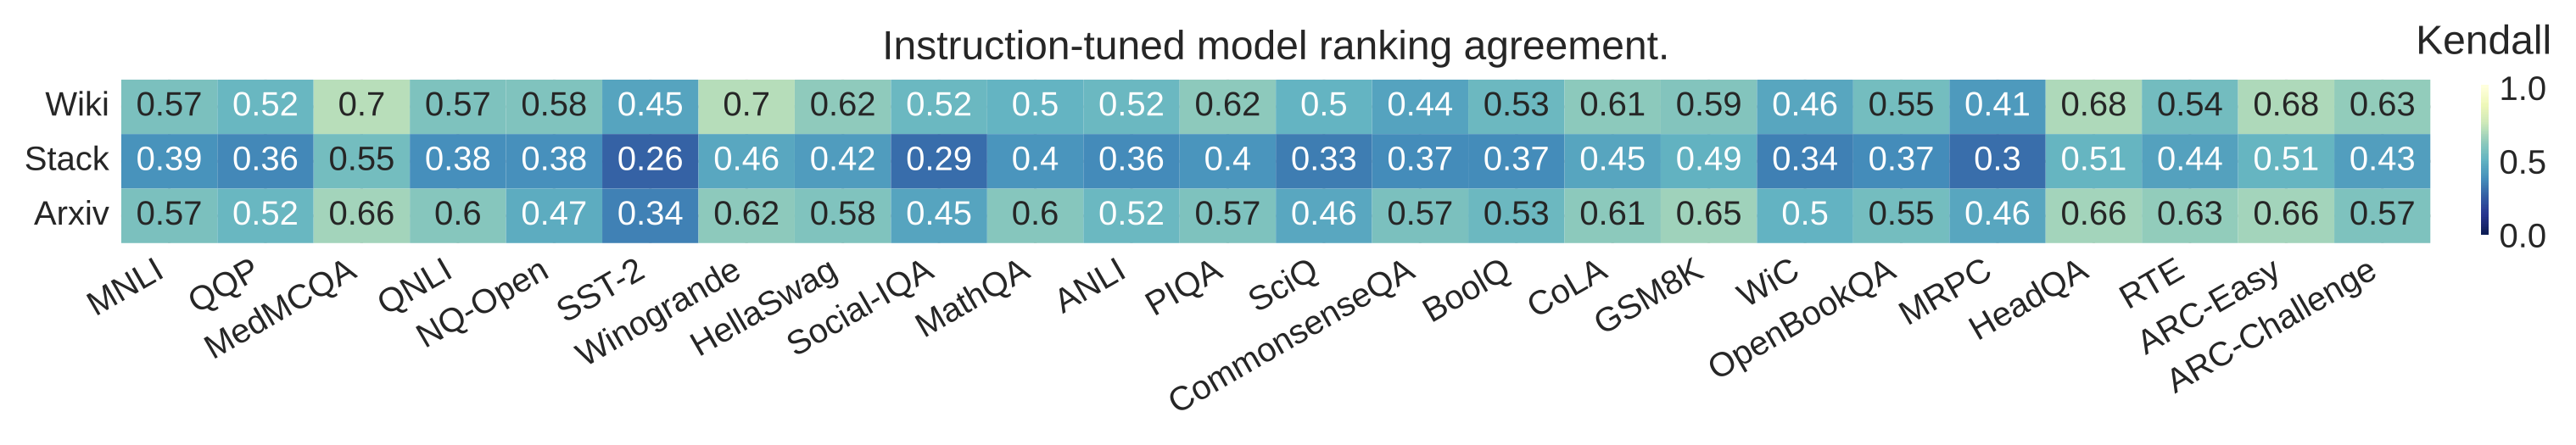
The picture is murkier for instruction-tuned models (τ = 0.51). Instruction tuning improves alignment while simultaneously worsening perplexity on general text, obscuring the underlying relationship.
Finding 3: Model Potential is One-Dimensional?
We ran PCA on the model × benchmark score matrix. Under direct evaluation, PC1 explains 70% of variance. After TBT, that rises to 86%.
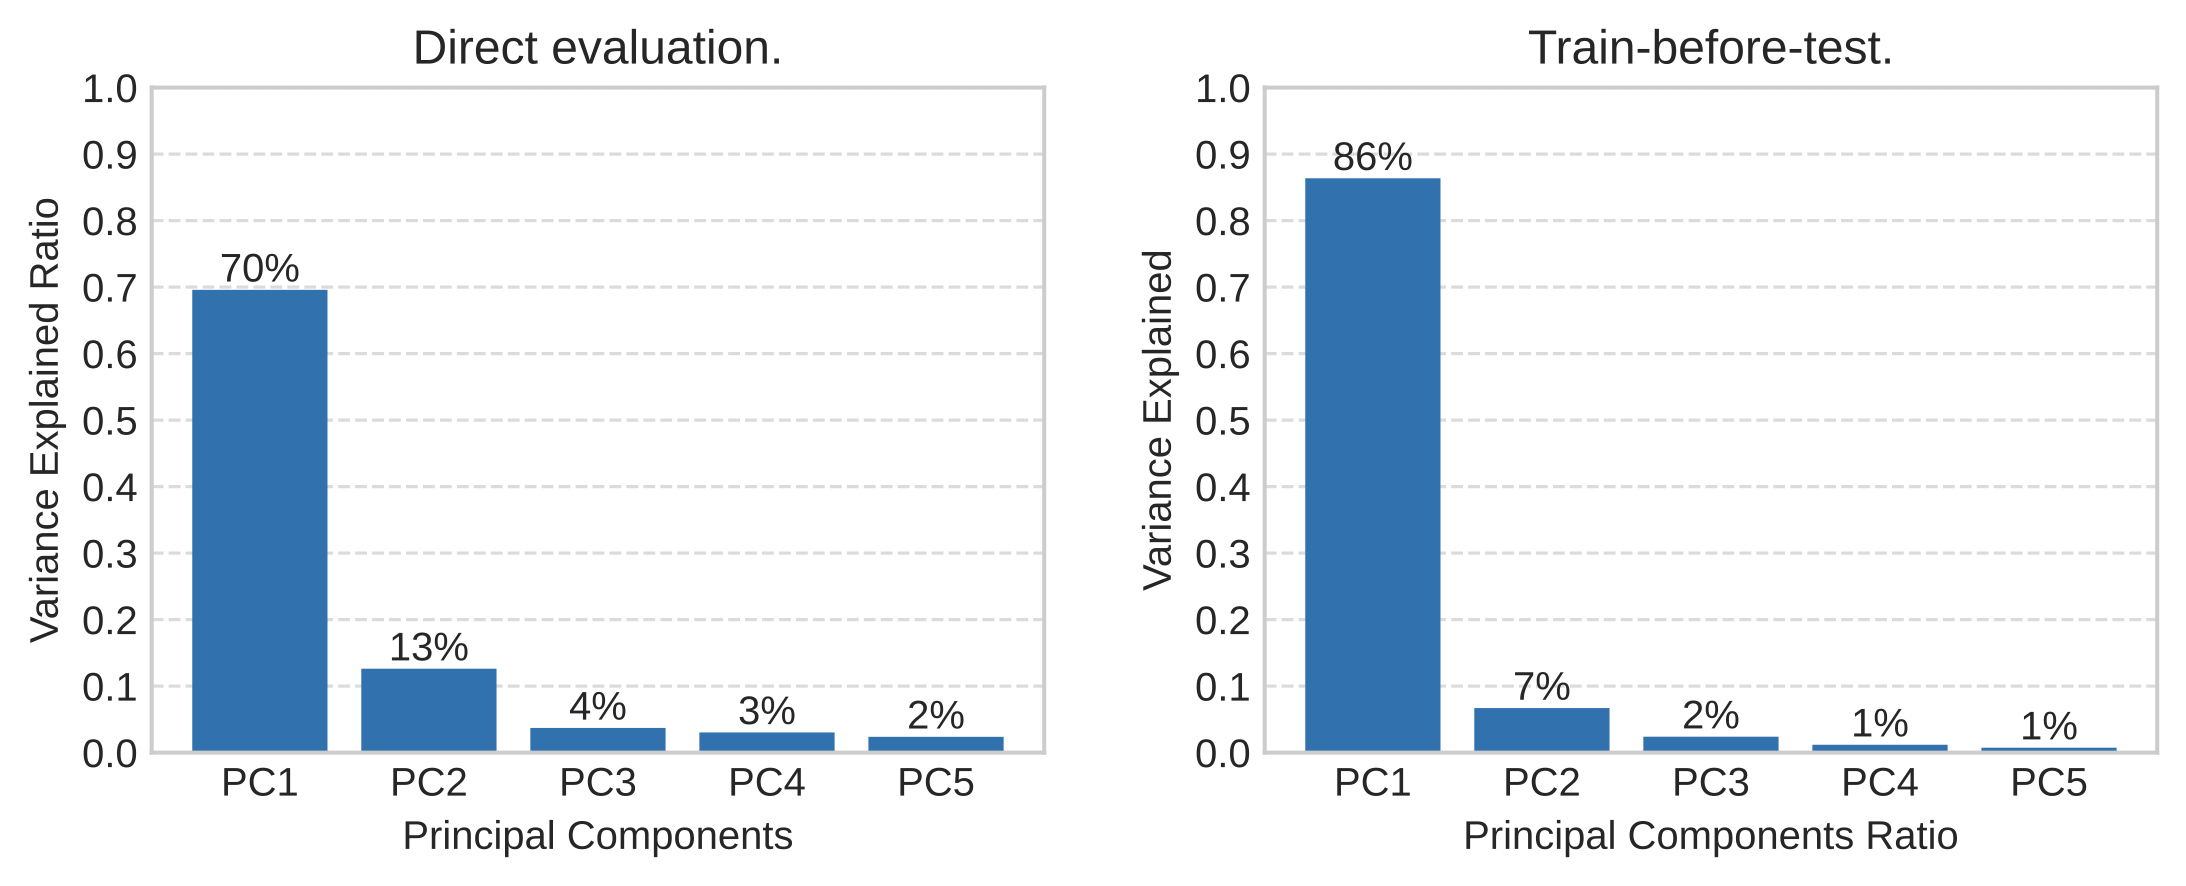
Within the Qwen family, PC1 explains 93% of variance. The matrix is essentially rank-1.
That is to say, after TBT, model performance across tasks is dominated by a single latent factor. Commonsense reasoning, reading comprehension, knowledge QA—the relative ordering of models stays roughly consistent across all of them. A stronger model tends to be stronger everywhere.
The dominant factor correlates strongly with pre-training compute. The secondary components visible under direct evaluation may reflect benchmark-specific pre-training exposure, though untangling exactly what drives them remains an open question.
What It’s Actually Useful For
For model builders, TBT offers a complementary signal to standard evaluation—particularly useful when selecting checkpoints or iterating on pre-training data mixtures, where you care about long-run learning potential rather than out-of-the-box performance. For base model selection, pre-TBT perplexity is already a reasonable proxy.
For model users, the two evaluation styles answer different questions. Direct leaderboards tell you what works best immediately, with no adaptation. TBT rankings tell you what tends to adapt best when fine-tuned on new data. Depending on your deployment scenario, one or the other may be more relevant.
For benchmark designers, TBT improves external validity—results on one benchmark become more predictive of results on others, which is a useful property for evaluation infrastructure to have.
Open Questions
The obvious cost of TBT is compute. Fine-tuning every model on every benchmark adds up. Whether you can approximate the same ranking benefits with fewer steps, parameter-efficient tuning, or smarter data selection is an open and practically important question.
The more interesting question is what the dominant latent factor actually is. Scale and compute correlate strongly, but data quality, architecture, and optimization choices all play a role. TBT doesn’t just fix the ranking problem—it sharpens the scientific question underneath it.
Leaderboard · Code · Paper